Be Free.
Think Macro.
Invest Smarter.
Our macro-investing philosophy focuses on the powerful forces that shape markets: economics, policy, and politics. We believe these aren’t just trends—they’re the drivers of opportunity, risk, and long-term growth.
By embracing a top-down macro perspective predicated on monetary and fiscal policy, we help investors identify critical turning points in markets and position their portfolios with precision. From asset classes to geographies and industries, we enable you to think bigger and act decisively.
Elevating Portfolio Optimization to New Heights
ALTITUDE AI™
Our proprietary ALTITUDE AI™ technology replicates advanced quantitative hedge fund strategies using large language models to create dynamically optimized portfolios that adapt to market conditions.
Our institutional macro investment approach combined with tomorrow’s leading technology produces portfolios that combine defensive diversification with robust downside protection, while still maintaining the flexibility to capture opportunistic alpha on the upside when market conditions shift. This data-driven approach to portfolio management is designed to maximize performance while intelligently managing risk.

Macro Investing
Expertise
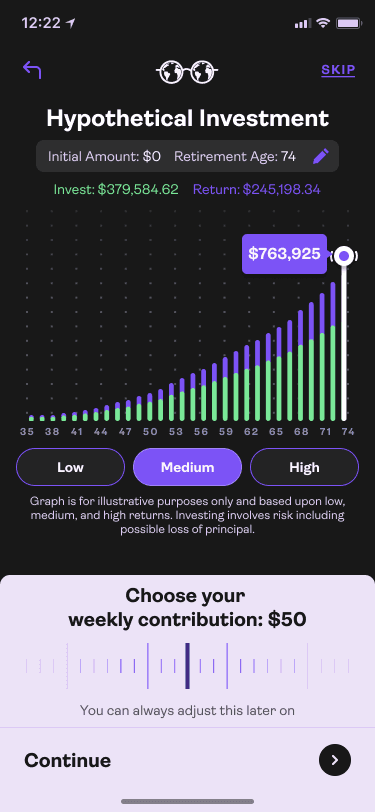
We employ macroeconomic analysis to develop investment strategies tailored to your financial goals. Our approach aims to provide automated investing options that consider broad economic trends while aligning with your unique objectives. We strive to offer valuable insights and tools to help you navigate complex markets, balancing potential returns with thoughtful risk management.
Personalized
Solutions
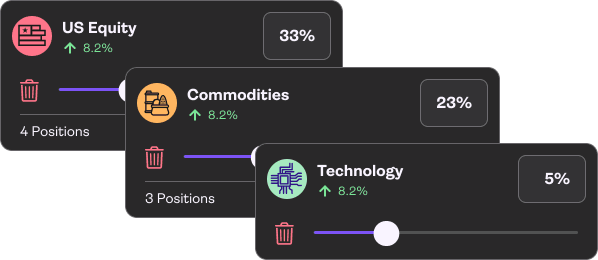
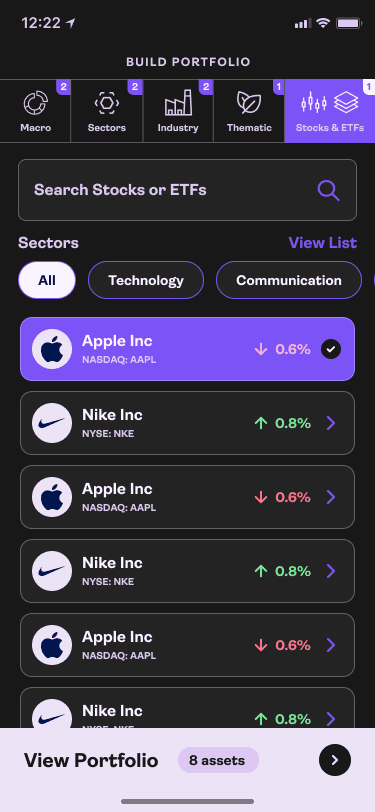
Customized investment plans designed to align with your risk tolerance and financial goals. Looking for institutional-grade portfolio management? Explore our AI-powered managed portfolios designed to adapt and help grow your wealth. Prefer to stay hands-on? Our self-managed portfolio option gives you the tools and flexibility to make informed investment decisions.


Comprehensive
Wealth Tracking
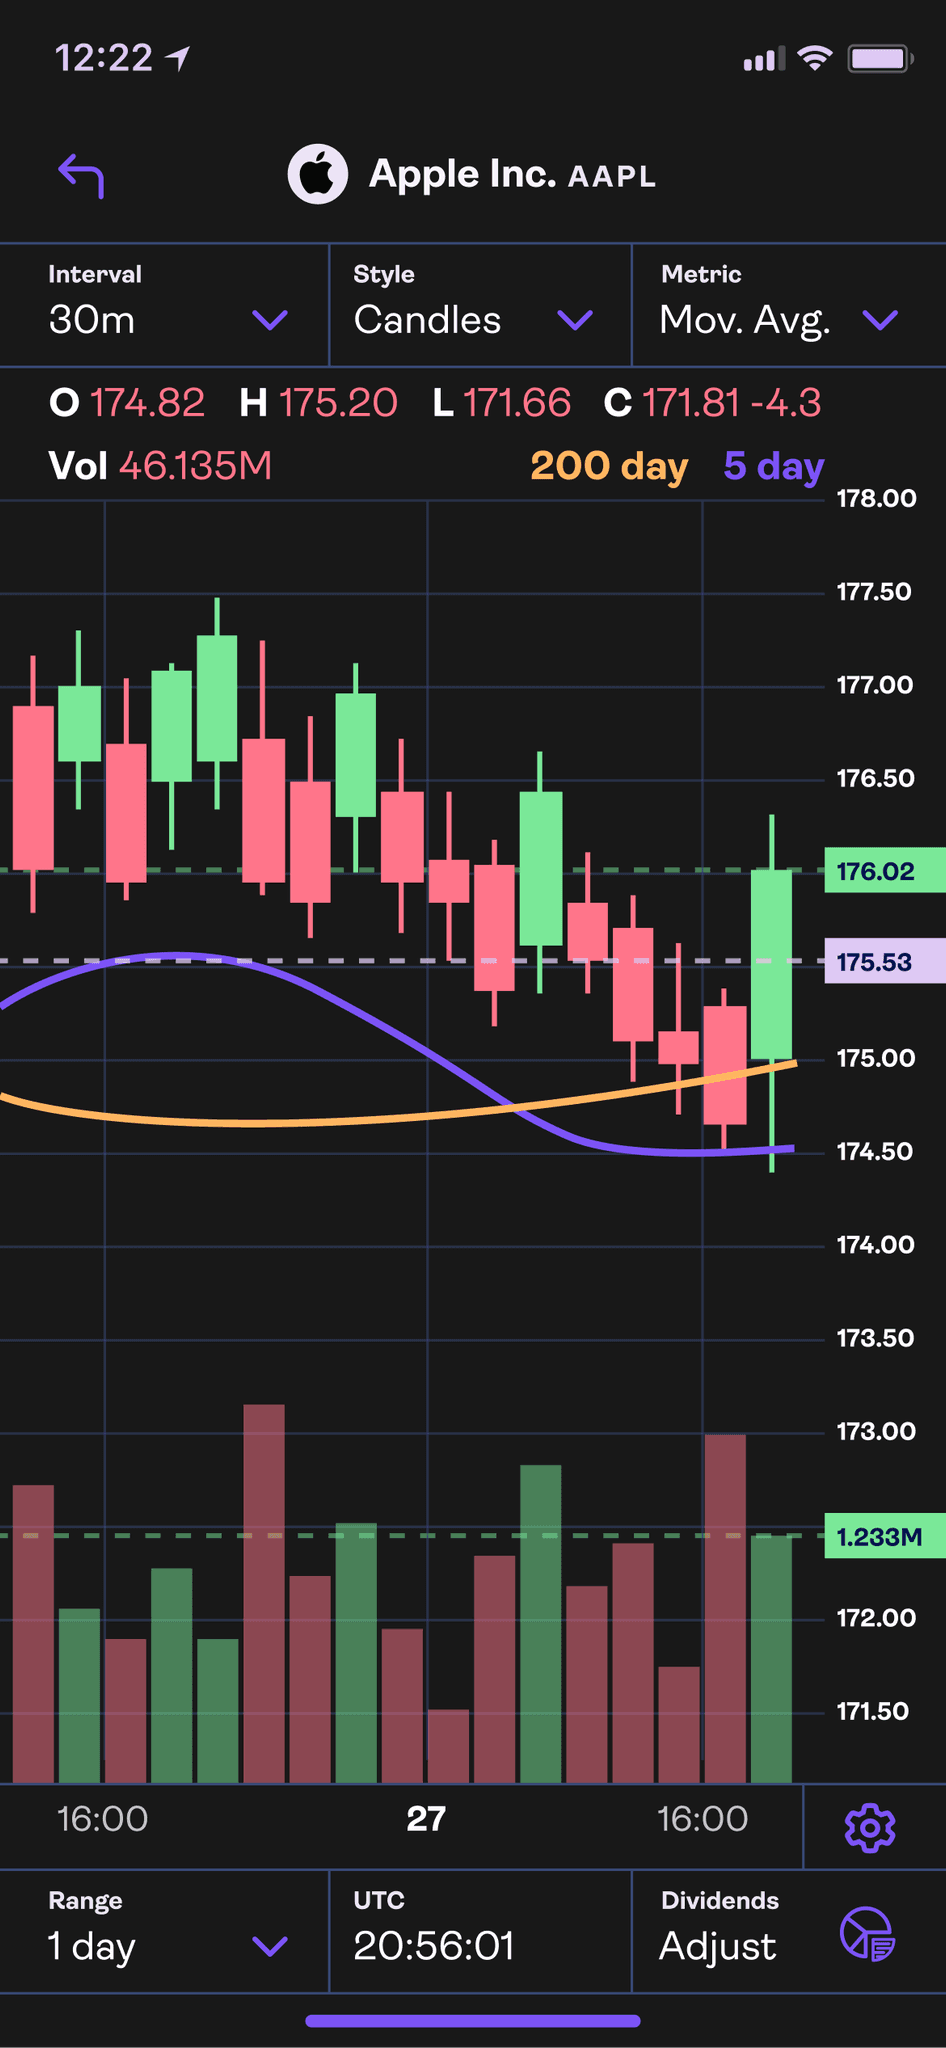
Easily connect your accounts and assets to see your entire financial world in one place. With Allio’s Wealth Tracker, you’ll get a real-time, full-picture view of your net worth—so you can stay in control and ahead of your goals.

Invest with autonomy, leverage expert-led strategies, and stay ahead with real-time insights.
One Platform, Total Control
What We Do
What We Say
Who We Are
Legal
Allio Advisors LLC ("Allio") is an SEC registered investment advisor. By using this website, you accept our Terms of Service and our Privacy Policy. Allio's investment advisory services are available only to residents of the United States. Nothing on this website should be considered an offer, recommendation, solicitation of an offer, or advice to buy or sell any security. The information provided herein is for informational and general educational purposes only and is not investment or financial advice. Additionally, Allio does not provide tax advice and investors are encouraged to consult with their tax advisor. By law, we must provide investment advice that is in the best interest of our client. Please refer to Allio's ADV Part 2A Brochure for important additional information. Please see our Customer Relationship Summary.
Online trading has inherent risk due to system response, execution price, speed, liquidity, market data and access times that may vary due to market conditions, system performance, market volatility, size and type of order and other factors. An investor should understand these and additional risks before trading. Any historical returns, expected returns, or probability projections are hypothetical in nature and may not reflect actual future performance. Past performance is no guarantee of future results.
Brokerage services will be provided to Allio clients through Allio Markets LLC, ("Allio Markets") SEC-registered broker-dealer and member FINRA/SIPC . Securities in your account protected up to $500,000. For details, please see www.sipc.org. Allio Advisors LLC and Allio Markets LLC are separate but affiliated companies. Allio Capital does not offer services to Florida.
Securities products are: Not FDIC insured · Not bank guaranteed · May lose value
Any investment , trade-related or brokerage questions shall be communicated to support@alliocapital.com
Please read Important Legal Disclosures
v1 01.20.2025


