Updated December 4, 2023
Mike Zaccardi, CFA, CMT
Macro Money Monitor
Market Recap
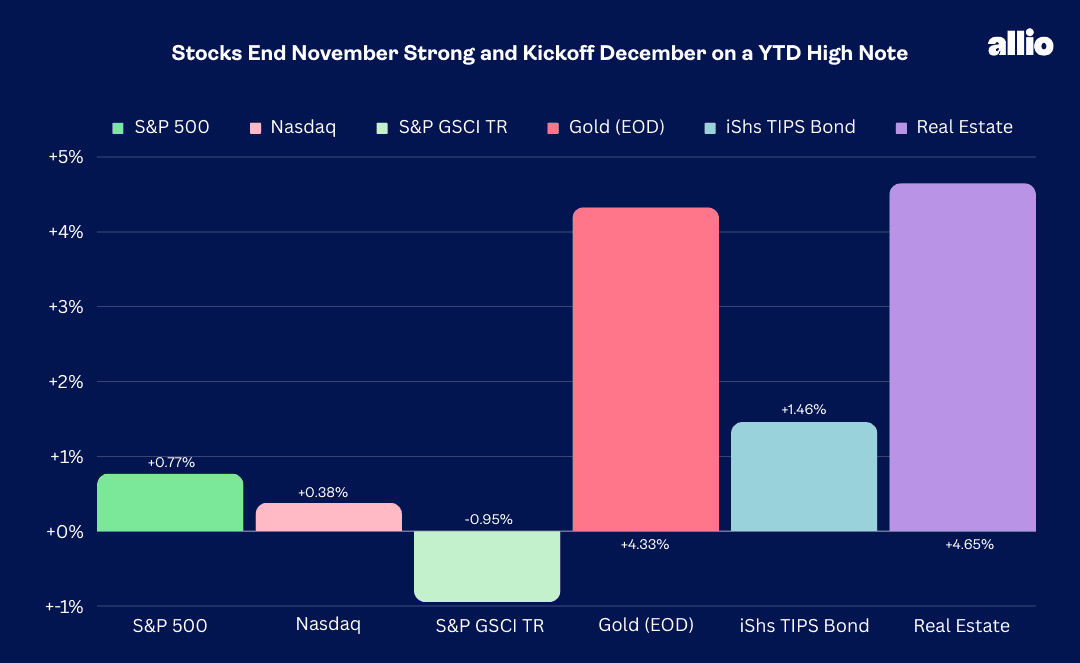
Stocks rose for a fifth straight week, with the S&P 500 settling at its best level since March 2022. Large caps rallied less than a percent, but there was significant strength seen in the small and mid-cap spaces as the rebound off lows notched in October broadens out. The Nasdaq Composite underperformed, though the tech-heavy group finished in the black last week.
Sector-wise, Real Estate led the charge, up almost 5%, and this rate-sensitive slice of the SPX is fast approaching Information Technology for the quarter-to-date sector performance lead.
A remarkable rally in Treasuries has certainly been a tailwind for REITs, and it has benefitted some hard assets, too. Spot gold ended Friday at a fresh all-time weekly high close, just shy of $2090. The precious metal gets a lot of attention for its inflation-hedging characteristics, but it tends to do well when real interest rates are on the decline. A nearly 80-basis-point drop in the 10-year Treasury rate since the high in October has boosted the aggregate fixed income space to a solid year-to-date advance – TIPS were up 1.5% last week.
Oil, meanwhile, is trading as if a significant economic slowdown is in the offing. WTI’s $74 settle on Friday pressured the overall commodity complex to a 1% weekly decline.
For the year, the S&P 500 is up 19.7% and the Nasdaq is higher by 36.7%.

November 24, 2023 - December 1, 2023
The Look Ahead
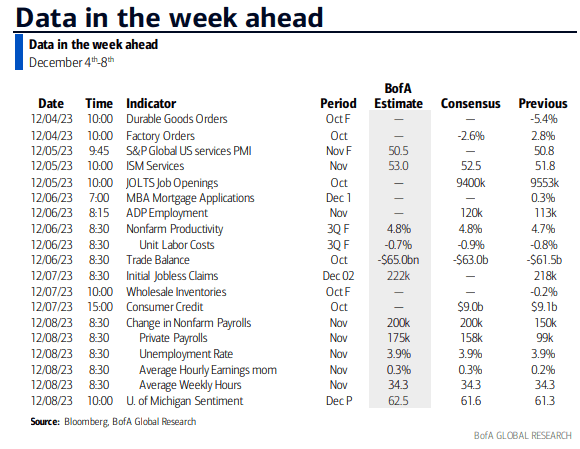
The week gets going with a pair of October data points, with Durable Goods Orders and Factory Orders at 10 a.m. ET on Monday. What could also get stocks moving is the ISM Services survey’s release on Tuesday – the market expects a rebound from October’s 5-month low PMI level, and close attention will be paid to its New Orders, Employment, and Prices Paid subindices given a weaker-than-expected ISM Manufacturing report last Friday.
The focus then turns to the employment situation. The October JOLTS figure was hotter than forecast last time around as the jobs market continues to hum along, albeit at a slower pace than what was seen earlier this year.
On Wednesday, the ADP Employment report for November offers a glimpse into the private sector payrolls situation – another lukewarm jobs gain is expected after the previous two months of roughly +100k prints. Following a final read on Q3 productivity (which soared last quarter), the Jobless Claims report is likely to show more of the same but keep your eye on Continuing Claims as it appears those being laid off are having a tough time landing new work.
The all-important November employment report hits Friday before the bell. Economists see a 200k payrolls gain and an unemployment rate sticky at 3.9%. Traders will focus on average hourly earnings and weekly hours worked data for clues on wage inflation, too. The week wraps up with a first look at the November University of Michigan Consumer Sentiment survey. Investors get a break from Fed Speak as the FOMC is in its pre-meeting blackout period.
This Week's Data Deck: The Focus Will Be on the Employment Report, ISM Services, and Consumer Sentiment

Source: BofA Global Research
Earnings Reports This Week
The late-season reports can offer sneaky clues on recent economic inflections. Indeed, we’ll hear from companies across the sector spectrum, focusing on a handful of consumer firms.
The Chinese EV automaker Nio (NIO) reports results Tuesday in the premarket along with AutoZone (AZO) before another member of the Consumer Discretionary space, Toll Brothers (TOL) hopes to build on a series of bottom-line beats. The lower-end consumer will then be in focus Thursday BMO when Dollar General (DG) reports. Broadcom (AVGO) serves up an update on the semiconductor chip industry Thursday night along with retail results from a fresh member of the S&P 500, Lululemon (LULU). Keep RH (RH) on your radar, too, as shares of the high-end home furnishing seller fell big after its September earnings release.
Heading into year-end, S&P 500 operating EPS estimates are homing in on $221 while out-year forecasts ticked up late last month to $246, putting the S&P 500 18.7 times 2024 earnings.
Nio, AutoZone, Toll Brothers, GameStop, Dollar General, Broadcom, Lululemon, Restoration Hardware Are the Earnings Headliners

Source: Earnings Whispers
Topic of the Week: Hey Big Spender
Optimism reigns across Wall Street. The S&P 500 delivered a dose of holiday cheer in November, registering one of its best months of the last three decades. The elixir of softening inflation trends, robust (though slowing) economic growth, a friendlier Fed, and corporate earnings that are on the ascent provided quite the sanguine backdrop as the final month gets going.
We’ve pointed out before how the November through April period has been, on average, the best six-month stretch for equities, but given where things stand now, tempering expectations could be prudent.
The S&P 500 often consolidates over the first half of December before a final upside spurt takes place. Then comes the often bantered “Santa Claus Rally,” the final five trading days of the year and the first two sessions of the new year. Traders then get back to business, parsing through economic data before the Q4 earnings season gets underway.
Strong Q3 GDP Growth, A 1%-2% Expansion Pace Expected in Q4
Macro reports last week were generally what the monetary policy doves and stock market bulls had on their wish lists. Among the more surprising figures was the second look at Q3 GDP. The initial growth rate of 4.9% (seasonally adjusted, annualized) was above economists’ expectations, and it was revised stronger from the preliminary pace.
The third-quarter expansion was updated to a cool 5.2%, driven by upward tweaks to business investment and government spending. Consumer spending growth was actually taken down from 4.0% to 3.6%.
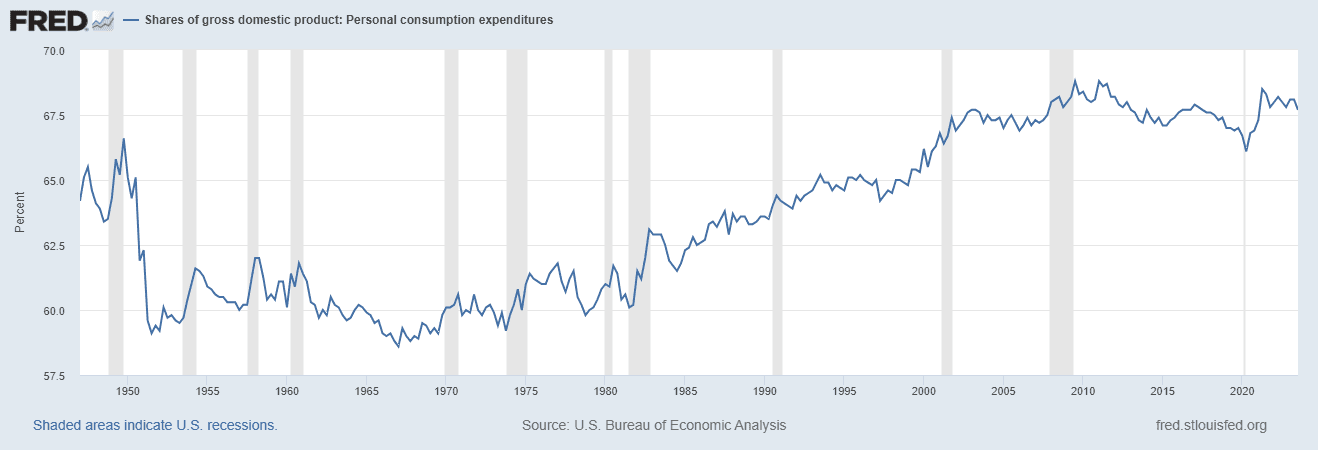
Going forward, it would be healthy if nonresidential and residential fixed investment picked up as a sign of longer-term economic health, rather than GDP being so dependent on a robust consumer. Examining historical data, in the 1950s through the 70s, personal consumption expenditures as a share of GDP ranged from 58% to 62%. The share peaked near 69% at times in 2021 and has dipped to 67.7% as of the end of the previous quarter, indicating high reliance on spending trends.
Now More Than Ever, It’s Up to the Consumer: PCE as a Percentage of GDP

Source: St. Louis Federal Reserve
Americans Doing What We Do Best
But, boy, did consumers deliver over the Thanksgiving weekend. Data-gathering firm Adobe Analytics reported that e-commerce spending on Black Friday jumped 7.5% from a year earlier. Total sales tallied $9.8 billion, yet another sign that it’s a “watch what I do, not what I say” economy right now.
Cyber Monday, a day largely conjured up by the online retail industry, also featured big spending. Americans were on the hunt for all the deals, with total Cyber Monday sales totaling $12.4 billion, another all-time high. For the entire Cyber Week (the five days from Thanksgiving through the following Monday), online shopping rose 7.8% year-on-year, beating the +5.4% expectation.
Stock prices often tell the truth, and shares of Shopify (SHOP) marched higher last week as the global online retail platform firm confirmed that merchants on its site hit a record $9.3 billion in sales from Black Friday through Cyber Monday, a whopping 24% surge from year-ago levels. SHOP Shares rallied on Monday but then consolidated during the remainder of the week.
Survey Data Paint a Weaker Picture
The hard data point to still-strong consumer spending. The soft data, on the other hand, remain unimpressive. Last Tuesday, The Conference Board released its monthly Consumer Confidence Index. Despite its increase from a downwardly revised 99.1 in October to 102.0 in November, individuals remain sour about the state of the economy. The index is closer to its 2020 lows than the pre-COVID highs.
Moreover, the Expectations Index remained under 80 for a third straight month – The Conference Board reports that such a trend historically signals a recession within the next year. Notably, two-thirds of respondents expect a recession over the next 12 months, deeming the chances “somewhat” or “very likely.”
Consumer Confidence Ticks Up in November, Remains Significantly Below Early-2020 Levels

Source: The Conference Board
The Beige Book
Gloomy macro views are not confirmed to households, either. The Fed’s Beige Book survey of business conditions around the country, issued last Wednesday, confirmed a broad slowdown in the employment market over the last few months. In an interesting trend, regional Fed districts concluded that retail sales, particularly demand for longer-term durable goods, declined. Recall comments from Doug McMillon, CEO of Walmart, on the retailer’s Q3 earnings conference call – he cited a sluggish end to October before better sales trends ensued in November. It’s as if Americans were gearing up for all the holiday deals.
Another Weak ISM Manufacturing Print
The Beige Book revealed mixed manufacturing activity. Last Friday’s November ISM Manufacturing report showed the same. The Institute for Supply Management Manufacturing PMI gauge came in at 46.7, yet another sub-50 percentage, suggesting negative growth in that part of the domestic economy. Unchanged from the October survey, it was the 13th consecutive month of contraction.
The bright spot was a tick higher in New Orders, a leading economic indicator, but the Employment sub-index inched down to a four-month low of 45.8, making this week’s labor market reports all the more important. The Prices Paid component jumped to 49.9, the highest since April. The disappointing manufacturing survey was offset to an extent by a strong Chicago PMI. That business barometer climbed to 55.8 last month from just 44 in October – it was the first monthly growth in Chicago’s economic activity since August last year, says the ISM.
PCE Data Suggest Inflation Continues to Abate
Finally, cementing this mixed view on the state of the US macro situation, October Personal Income & Outlays, along with October Personal Consumption Expenditure (PCE) data, hit the tape last Thursday morning following a surprising jump in continuing jobless claims. At +0.2% for the month, both income and spending levels verified near expectations, though September’s income gauge was revised higher to +0.4 from +0.3%. Real Personal Spending increased by 0.2% with the PCE Deflator, measuring inflation, showing no change in prices for October. On a year-over-year basis, the PCE Deflator came in lighter than forecasts at +3.0%.
The Fed’s Next Move (Hint: It Won’t Come Next Week)
That data was good enough for Chair Powell. The Fed chief had a pair of Friday speaking engagements at Spelman College in Atlanta. After outright dovish comments from Fed governor Chris Waller Tuesday last week, hinting at possible rate cuts in the next three to five months, some pundits suspected the chairman would talk markets down following their red-hot November performance. That didn’t happen.
While Powell pushed back on the market’s currently aggressive expectations for up to five eases next year, he remarked that the FOMC is likely finished raising rates as the Fed proceeds carefully with monetary policy amid more balanced inflation and growth risks.
Stocks rose and bond yields fell to start December and close out the week. The Fed’s December 13 meeting now appears to be an anticlimactic end to what has been a dramatic year of Fed Speak and ever-changing rate-hike expectations. As it stands, the final interest rate increase appears to have been five months ago, and traders expect the first cut in March.
The Bottom Line
Consumers should give themselves a pat on the back. The latest stock market jump comes on the back of robust retail sales activity following Thanksgiving. At the same time, inflation fears have been largely put to bed, and mixed economic data, including softness in the manufacturing sector, appear sufficient for the Fed to begin talking about rate cuts soon. Investors should keep their seasonal bullishness in check, though, following a stunning equity market rally since late October.
Want access to your own expert-managed investment portfolio? Download Allio in the app store today!


