Allio Capital Team
The Macroscope
Introduction: Why Unemployment Remains a Core Economic Indicator
Unemployment is more than just a statistic—it’s one of the most vital measures of an economy’s health. A nation’s unemployment rate reflects not only job availability but also productivity, consumer confidence, and economic growth potential.
In 2025, as automation, inflation, and global uncertainty reshape labor markets, understanding how to calculate unemployment and the different forms it takes has never been more important for policymakers, businesses, and investors alike.
How to Calculate Unemployment: The Basics
The Unemployment Rate Formula
The unemployment rate formula is simple but powerful:
Unemployment Rate=Number of Unemployed PeopleLabor Force×100\text{Unemployment Rate} = \frac{\text{Number of Unemployed People}}{\text{Labor Force}} \times 100Unemployment Rate=Labor ForceNumber of Unemployed People×100
Where:
Unemployed = People actively seeking work but not currently employed.
Labor Force = Employed + Unemployed individuals.
This metric helps economists monitor economic cycles and identify when intervention is needed.
Data Sources Used in the U.S.
In the United States, the Bureau of Labor Statistics (BLS) conducts the Current Population Survey (CPS) monthly to estimate employment data.
Hidden Unemployment
The official unemployment rate excludes discouraged workers—those who’ve stopped looking for jobs. When they’re included, we get the U-6 rate, which offers a fuller picture of underemployment.
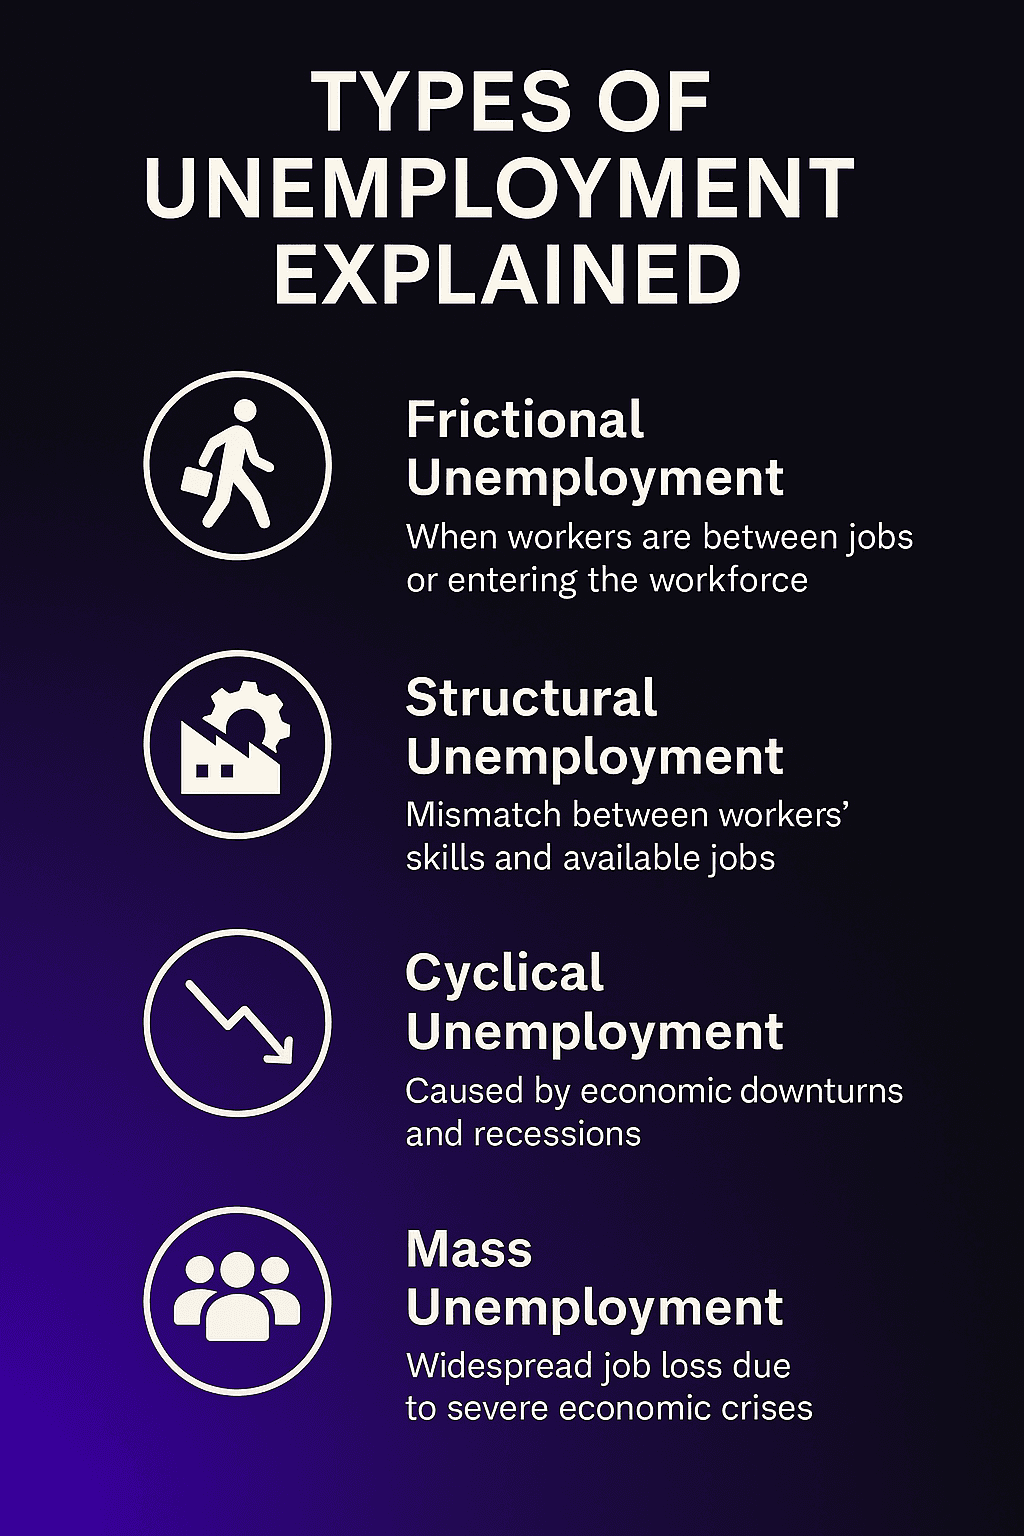
Types of Unemployment Explained
Unemployment is not one-size-fits-all. Economists categorize it into several forms based on causes and duration.
1. Frictional Unemployment
Frictional unemployment occurs naturally when workers transition between jobs, relocate, or enter the labor force for the first time.
It reflects a dynamic, flexible economy rather than a failing one. For example, a software engineer leaving one firm to join another is frictionally unemployed during that interim.
2. Structural Unemployment
Structural unemployment arises from mismatches between worker skills and market needs—often driven by technological change or globalization.
Example: Automation in manufacturing has displaced workers lacking advanced technical training.
3. Cyclical Unemployment
Cyclical unemployment fluctuates with the business cycle. It spikes during recessions, when demand falls and companies cut jobs, and decreases during expansions.
For instance, the 2008 financial crisis caused widespread cyclical unemployment across multiple industries.
4. Seasonal Unemployment
This occurs in industries like agriculture, retail, and tourism that experience predictable annual patterns.
5. Mass Unemployment
Mass unemployment describes severe, widespread job loss—often linked to systemic economic failure or crisis. Historical examples include the Great Depression and COVID-19 lockdowns, when jobless rates soared into double digits globally.
The Natural Rate of Unemployment
Definition
The natural rate of unemployment represents the level of joblessness that exists even when the economy operates at full capacity. It includes frictional and structural unemployment, but excludes cyclical fluctuations.
This is often considered the "baseline" or sustainable unemployment rate that doesn’t fuel inflation.
Why the Economy Never Reaches 0% Unemployment
A zero percent unemployment rate is neither realistic nor desirable. Constant labor movement, skill shifts, and economic innovation ensure that some unemployment is inevitable.
Which Unemployment Rate Do Most Economists Consider Acceptable in the United States?
Most economists agree that an unemployment rate between 4% and 5% represents the natural rate of unemployment in the United States.
This range reflects a balance—enough job fluidity to support innovation without causing inflationary pressure.
Frictional, Structural, and Cyclical Unemployment in Practice
Frictional Unemployment: A Sign of a Healthy Labor Market
When employees feel confident enough to leave jobs for better ones, it indicates optimism and opportunity. High frictional unemployment often follows strong economic expansion.
Structural Unemployment: The Challenge of Progress
As industries evolve, so must the workforce. Policies that support reskilling and education are critical to minimizing structural unemployment.
Cyclical Unemployment: Managing Economic Downturns
Central banks combat cyclical unemployment with expansionary monetary policy, such as lowering interest rates or quantitative easing to stimulate demand.
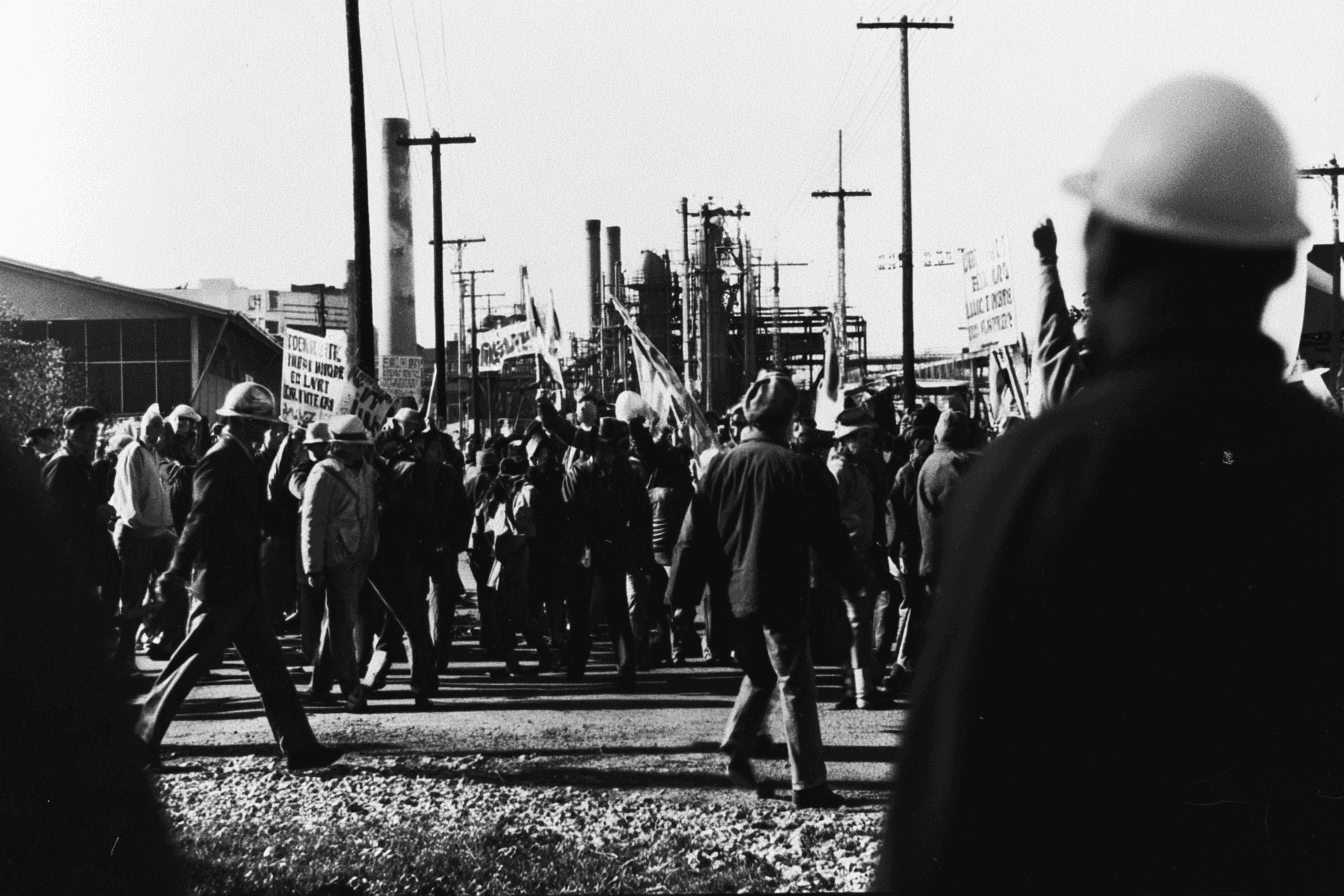
Mass Unemployment: When the Labor Market Breaks Down
Historical Case Studies
The Great Depression (1930s): U.S. unemployment exceeded 25%.
2008 Financial Crisis: Global financial systems froze, creating widespread job losses.
COVID-19 Pandemic: Triggered modern mass unemployment, with over 20 million U.S. jobs lost in a single month (April 2020).
Social and Economic Impacts
Mass unemployment can lead to:
Lower consumer spending
Increased poverty and social unrest
Long-term loss of skills and productivity
Policy Tools for Mitigation
Fiscal stimulus and government hiring programs
Infrastructure spending to create jobs
Enhanced unemployment insurance
Unemployment Policy, Inflation, and the Phillips Curve
The Phillips Curve illustrates the relationship between unemployment and inflation: as unemployment falls, inflation tends to rise.
However, in modern economies, this relationship has weakened due to globalization and automation. Policymakers must now balance full employment goals with price stability, using targeted fiscal and monetary tools.
Modern Challenges in Measuring and Addressing Unemployment
AI and Automation
Automation poses structural challenges, potentially increasing technological unemployment as machines replace human labor in routine tasks.
Gig Economy and Freelance Work
Gig workers often fall outside traditional employment statistics, complicating how we calculate unemployment in the modern age.
Post-Pandemic Labor Trends
Remote work, reshoring, and hybrid employment models are redefining workforce participation metrics, making labor market analysis more nuanced.
Frequently Asked Questions (FAQs)
1. What is the unemployment rate formula?
Unemployment Rate = (Unemployed ÷ Labor Force) × 100.
2. Which unemployment rate do most economists consider acceptable in the United States?
Between 4% and 5%, representing the natural rate of unemployment.
3. What causes frictional unemployment?
Voluntary job transitions, relocations, or career changes.
4. What is cyclical unemployment?
Job loss caused by economic downturns or recessions.
5. What leads to structural unemployment?
Shifts in technology or trade that make certain skills obsolete.
6. How can mass unemployment be prevented?
Through government stimulus, reskilling initiatives, and active labor market programs.
Conclusion: The Future of Employment in a Changing Economy
Understanding the natural rate of unemployment and its underlying components—frictional, structural, and cyclical—is crucial to evaluating economic health.
Periods of mass unemployment remind us of the importance of balanced policies, innovation, and resilience in labor markets. As technology and global dynamics evolve, policymakers must adapt how they calculate unemployment, define participation, and manage long-term growth.
A sustainable unemployment rate—neither too high nor too low—remains central to achieving stable, inclusive, and lasting prosperity.