
Macro Dashboard
A professional-grade toolkit for analyzing economic regimes, policy shifts, and market signals. Built for investors who think in cycles.
Indicators at
Your Fingertips
A curated suite of key economic indicators, updated continuously from reliable sources:
Growth Metrics
Real GDP, Real Personal Income, Industrial Production
Inflation Measures
Consumer Price Index (CPI), Personal Consumption Expenditures (PCE), Producer Price Index (PPI)
Discount Rate
SOFR Spreads, Fed Funds Rate, Bond Yields
Risk Premia
VIX, Gold, Consumer Sentiment

Macro Dashboard
A professional-grade toolkit for analyzing economic regimes, policy shifts, and market signals. Built for investors who think in cycles.
Indicators at
Your Fingertips
A curated suite of key economic indicators, updated continuously from reliable sources:
Growt Metrics
Growth Metrics
Real GDP, Real Personal Income, Industrial Production
Inflation Measures
Consumer Price Index (CPI), Personal Consumption Expenditures (PCE), Producer Price Index (PPI)
Discount Rate
SOFR Spreads, Fed Funds Rate, Bond Yields
Risk Premia
VIX, Gold, Consumer Sentiment
Regime-Based Asset Insights
Regime-Based Asset Insights
Compare asset returns across different economic cycles including stagflation, booms, and busts to help guide your next portfolio move.
Compare asset returns across different economic cycles including stagflation, booms, and busts to help guide your next portfolio move.
Deflation + Decline
Inflation + Decline
Inflation + Growth
Deflation + Decline
Deflation + Growth
Inflation + Decline
Deflation + Decline
Inflation + Decline
Inflation + Growth
Inflation + Decline
1990
1995
2000
2005
2010
2015
2020
2025
Detailed Economic Graphs

Dive deeper into key economic indicators with interactive, easy-to-navigate charts.
Adjustable Date Ranges
Explore CPI, GDP, and other indicators across custom time frames. Zoom out for long-term cycles or focus on recent releases.
Driver Breakdown
See the components behind each indicator, such as how personal income, retail sales, or job openings contribute to growth trends.
Historical Context
Access multi-year charts to understand how today’s data fits into broader economic cycles.
Regime-Based Asset Insights
Compare asset returns across different economic cycles including stagflation, booms, and busts to help guide your next portfolio move.
Compare asset returns across different economic cycles including stagflation, booms, and busts to help guide your next portfolio move.
Deflation + Decline
Inflation + Decline
Inflation + Growth
Deflation + Decline
Deflation + Growth
Inflation + Decline
Deflation + Decline
Inflation + Decline
Inflation + Growth
Inflation + Decline
1990
1995
2000
2000
2005
2010
2015
2020
2025
Dive deeper into jey economic indicators with interactive, easy-to-navigate charts.

Adjustable Date Ranges
Explore CPI, GDP, and other indicators across custom time frames. Zoom out for long-term cycles or focus on recent releases.
Driver Breakdown
See the components behind each indicator, such as how personal income, retail sales, or job openings contribute to growth trends.
Historical Context
Access multi-year charts to understand how today’s data fits into broader economic cycles.
Detailed Economic Graphs
Detailed Economic Graphs
Detailed Economic Graphs
Adjustable Date Ranges
Explore CPI, GDP, and other indicators across custom time frames. Zoom out for long-term cycles or focus on recent releases.
Driver Breakdown
See the components behind each indicator, such as how personal income, retail sales, or job openings contribute to growth trends.
Historical Context
Access multi-year charts to understand how today’s data fits into broader economic cycles.
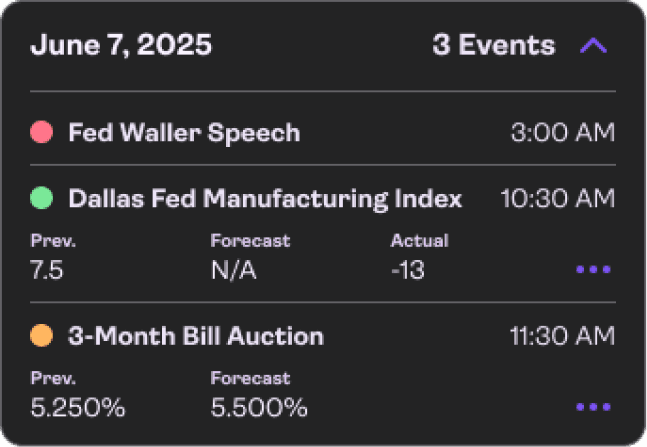
Macro Calendar
Stay on top of market-moving events such as Fed meetings, jobs reports, and CPI releases. Filter by importance and view quick summaries of expectations and prior numbers.
Why Use the Macro Dashboard?
Why Use the Macro Dashboard?
Institutional-Grade Research
The same frameworks used by professional macro strategists, now in a self-service app.
Holistic View
Combine event data, indicator readings, and regime analysis in one interface.
Actionable Regime Signals
Identify turning points and align your strategy with prevailing economic cycles.
Custom Analysis
Analyze trends and patterns directly within the platform to guide your next moves.
What We Do
What We Say
Legal
Who We Are
By using this website, you accept our Terms of Service and our Privacy Policy. Nothing on this website should be considered an offer, recommendation, solicitation of an offer, or advice to buy or sell any security. The information provided herein is for informational and general educational purposes only and is not investment or financial advice. Additionally, Allio does not provide tax advice and investors are encouraged to consult with their tax advisor.
v1 01.22.2026
What We Do
What We Say
Legal
Who We Are

By using this website, you accept our Terms of Service and our Privacy Policy. Nothing on this website should be considered an offer, recommendation, solicitation of an offer, or advice to buy or sell any security. The information provided herein is for informational and general educational purposes only and is not investment or financial advice. Additionally, Allio does not provide tax advice and investors are encouraged to consult with their tax advisor.
v1 01.22.2026
Macro Calendar
Stay on top of market-moving events such as Fed meetings, jobs reports, and CPI releases. Filter by importance and view quick summaries of expectations and prior numbers.
Macro Dashboard
A professional-grade toolkit for analyzing economic regimes, policy shifts, and market signals. Built for investors who think in cycles.
Adjustable Date Ranges
Explore CPI, GDP, and other indicators across custom time frames. Zoom out for long-term cycles or focus on recent releases.
Driver Breakdown
See the components behind each indicator, such as how personal income, retail sales, or job openings contribute to growth trends.
Historical Context
Access multi-year charts to understand how today’s data fits into broader economic cycles.
Detailed Economic Graphs
Macro Calendar
Stay on top of market-moving events such as Fed meetings, jobs reports, and CPI releases. Filter by importance and view quick summaries of expectations and prior numbers.